Industry News
Hospitality Giants 2017 – Interior Design
Jan
If the latest data is any indication, the 75 firms that make up Interior Design’s list of Giants in the hospitality sector are busier than ever. We know this because when business is good, a beautiful chain reaction of numbers happens.
Join the Interior Design Research Group to give us your feedback as well as get the first look at the research, white papers, and industry intelligence. If interested, send your contact information to Wing Leung at wleung@interiordesign.net
In partnership with Grohe at AF|NY
Title
The hospitality Giants worked on more than 5,100 total jobs in the past reporting period. (A number that’s climbed steadily from 1,950 since 2009, when we started checking in on this group.) In so doing, the Giants completed 235 million square feet of space, a 22 percent jump from the previous report and by far the highest total ever. As a result, the firms hired a total of 640 full-time designers to employ 8,600. Those hires brought in the green, too—average fees per staffer leaped to $164,000 from $149,000.
Based on that data, it makes sense that fees would rise. That’s part of the chain reaction, too. And total fees from hospitality design did come in at $684 million, a blip of a rise from the previous $681 million but still short of the high of $700 million from the 2014 report. It’s difficult to call such a robust total a “shortfall.” Based on the work and staff numbers, however, shouldn’t that number be higher?
This speaks to the biggest business challenge that all our Giants, not just the hospitality group, face year in and year out: Getting clients to pay what the work is worth. Or, as one staffer from SOSH Architects put it, the name of the game for clients is “smaller budgets, tighter timelines.” That shouldn’t detract, however, from what was overall a set of healthy numbers. The hospitality Giants drew 36 percent of their overall fees from hospitality work. For the ten firms with the most growth, fees rose by an average of 7 percent.
Fees by project type 2017
| Type | Salary |
|---|---|
| Hospitality | 684.2 |
| Corporate | 537.1 |
| Healthcare | 180.7 |
| Government | 93.4 |
| Retail | 90.5 |
| Transportation | 81.4 |
| Educational | 75.5 |
| Cultural | 72.6 |
| Residential | 52.1 |
| Other | 57.3 |
Fees by project type 2018 forecast
| Type | Salary |
|---|---|
| Hospitality | 739.8 |
| Corporate | 539.9 |
| Healthcare | 185.9 |
| Government | 95.1 |
| Retail | 97.1 |
| Transportation | 82.9 |
| Educational | 79.8 |
| Cultural | 75 |
| Residential | 57.1 |
| Other | 60.1 |
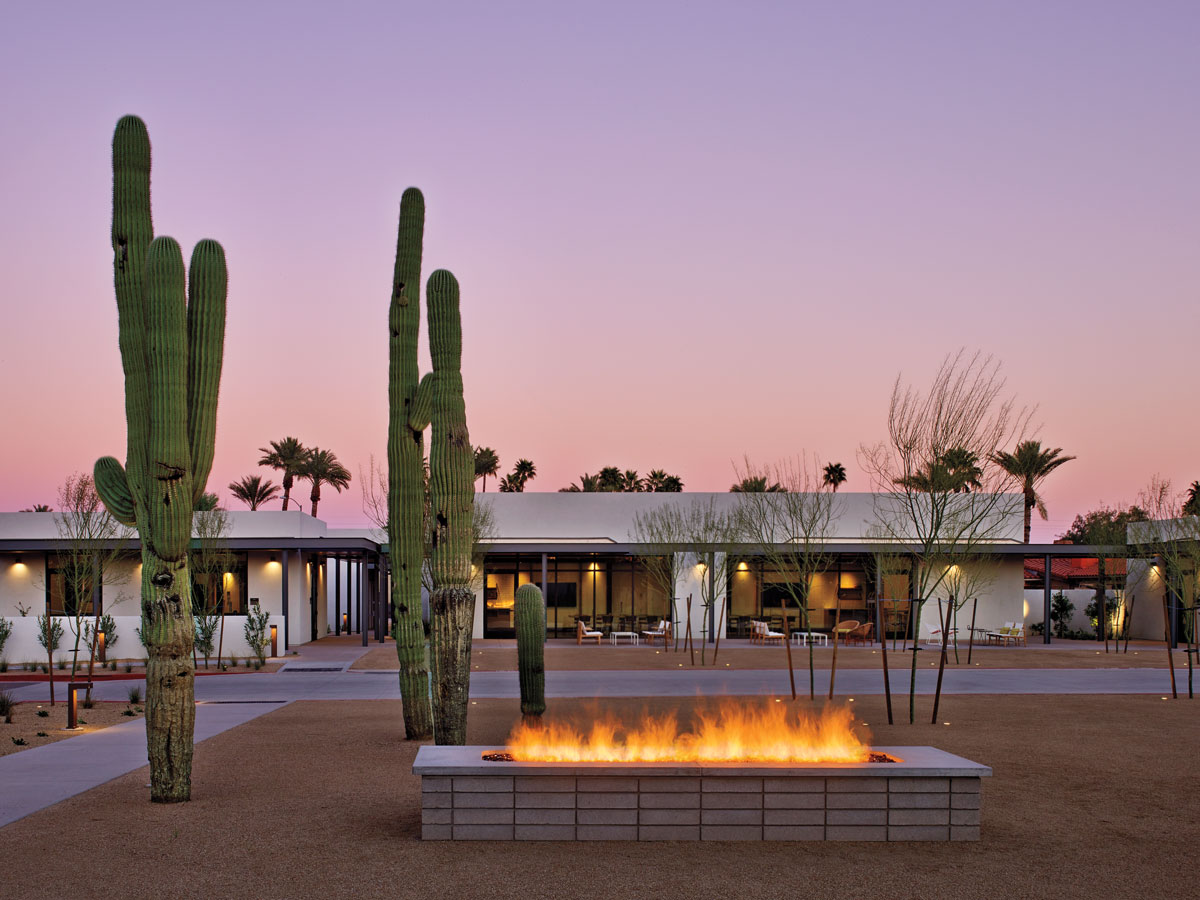
Hotels remain the biggest segment of the business, 57 percent, with the luxury category being the strongest. Restaurants, bars, and nightclubs are next with 13 percent of the business, followed by resorts with 9 percent. The hospitality Giants expect these segments to remain growth areas while also listing gaming as a particular hot spot. Another sexy buzzword is boutique. Consumers want the boutique experience in everything from hotels to gyms, and design firms are happy to oblige.
Business in furniture and fixtures looks healthy, too. Total installations of F&F and construction products rose 7 percent to $20 billion. If 7 percent sounds light, think of it another way: That’s an extra $1.2 billion. Next time? The hospitality Giants hope for $23 billion.
Fees by hospitality project type 2017
| Type | Salary |
|---|---|
| Hotels (luxury) | 166.5 |
| Hotels (boutique) | 124 |
| Hotels (mid/economy) | 102.4 |
| Restaurants | 90.7 |
| Resorts | 64.4 |
| Country Clubs | 27.4 |
| Bars / Lounges / Night Clubs | 26.2 |
| Gaming | 20.9 |
| Condos / Timeshares | 13.3 |
| Cruise Ships | 10.9 |
| Spas | 9.3 |
| Other | 28.1 |
Fees by hospitality project type 2018 forecast
| Type | Salary |
|---|---|
| Hotels (luxury) | 191.4 |
| Hotels (boutique) | 117.7 |
| Hotels (mid/economy) | 117.4 |
| Restaurants | 109.2 |
| Resorts | 67.7 |
| Country Clubs | 25.4 |
| Bars / Lounges / Night Clubs | 28.6 |
| Gaming | 33.7 |
| Condos / Timeshares | 11.5 |
| Cruise Ships | 1.3 |
| Spas | 8.7 |
| Other | 27.1 |
| Type | $ | formatted |
|---|---|---|
| New Construction | 0.43 | 43% |
| Renovation | 0.51 | 51% |
| Refresh previous projects | 0.06 | 6% |
| Type | $ | formatted |
|---|---|---|
| Domestic Projects | 0.78 | 78% |
| Overseas Projects | 0.22 | 22% |
| Type | Salary |
|---|---|
| Pierre-Yves Rochon | 0.9 |
| Hirsch Bedner Associates | 0.85 |
| Bilkey Llinas Design | 0.85 |
| Dalton Steelman Arias & Anderson (A Steelman Partners Affiliate) | 0.85 |
| Rebel Design+Group | 0.65 |
| Wimberly Interiors | 0.6 |
| DiLeonardo International | 0.6 |
| Smallwood, Reynolds, Stewart, Stewart & Associates | 0.57 |
| HKS | 0.55 |
| AECOM | 0.55 |
The U.S. continues to trend upward as the place where work happens. On average, 78 percent of each firm’s work was U.S.-based—compared to 64 percent reported in 2013. Of the 75 hospitality Giants, 93 percent see their highest growth potential in the U.S., particularly on the West Coast and in the South.
That said, international work remains big for some of the hospitality Giants, with 16 firms, 11 of them U.S.-based, completing more than half their work outside the U.S. A quarter of firms see growth potential in Mexico, 32 percent like South America and the Caribbean, and 38 percent are looking to Asia.
As a group, the hospitality Giants predict that good business will get better in the coming reporting period: $740 million in fees, 5,200 projects totaling 260 million square feet, and 9,100 employees making it all happen. To be fair, these Giants have been forecasting the $740 to $750 million level for a while now, so here’s hoping this is their moment. That’s a chain reaction we’d like to see continue.
| Type | Salary |
|---|---|
| Hirsch Bedner Associates | 11.5 |
| Rebel Design+Group | 7.7 |
| HKS | 5 |
| AvroKO | 4.1 |
| BAMO | 3.8 |
| ForrestPerkins | Perkins Eastman | 2.8 |
| Pierre-Yves Rochon | 2.3 |
| Rockwell Group | 1.4 |
| designONE studio | 1.2 |
| RDH Interests | 1.1 |
| Type | Salary |
|---|---|
| Hotels (boutique) | 0.8 |
| Hotels (luxury) | 0.74 |
| Restaurants / Bars / Lounges / Night clubs | 0.72 |
| Resorts / Spas / Country Clubs | 0.6 |
| Hotels (mid/economy) | 0.55 |
| Gaming | 0.45 |
| Condo-hotels / Timeshare | 0.28 |
| Cruise ships | 0.16 |
| Other | 0.48 |
The annual business survey of Interior Design hospitality Giants ranks the largest design firms by hospitality design fees for the 12-month period from July 2016 through June 2017. Hospitality design fees include those attributed to:
- All hospitality interiors work.
- All aspects of a firm’s hospitality design practice, from strategic planning and programming to design and project management.
- Fees paid to a firm for work performed by employees and independent contractors who are full-time staff equivalent.
Hospitality design fees do not include revenues paid to a firm and remitted to subcontractors that are not considered full-time staff equivalent. For example, certain firms attract work that is subcontracted to a local firm. The originating firm may collect all the fees and retain a management or generation fee, paying the remainder to the performing firm. The amounts paid to the latter are not included in the fees of the collecting firm when determining its ranking. Additionally, where applicable, all percentages are based on responding hospitality Giants, not their total number. The data was compiled and analyzed by the Interior Design market research staff, led by Wing Leung, research director.
Thank you for writing this awesome article. I’m a long time reader but I’ve never been compelled to leave a comment.